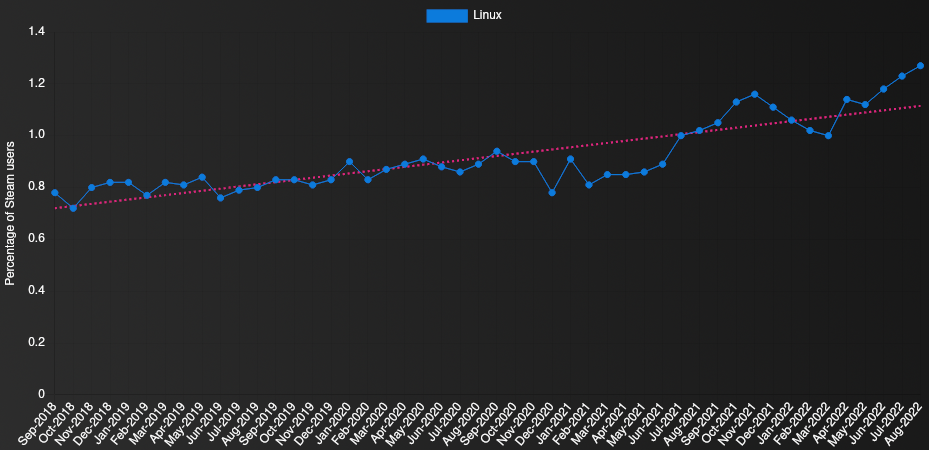
Another month has finished and the Steam Hardware & Software Survey has been refreshed. It shows once again that the Linux user share has risen.
Our Steam Tracker has been updated as usual but here's the chart to save you a click:
When you go to the Linux details page, these are the most popular distributions:
- SteamOS Holo 64 bit 13.69% +6.09%
- Arch Linux 64 bit 10.89% -2.98%
- "Manjaro Linux" 64 bit 8.93% -2.47%
- Ubuntu 22.04.1 LTS 64 bit 8.20% +8.20%
- Ubuntu 20.04.4 LTS 64 bit 7.06% -2.22%
- Linux Mint 20.3 64 bit 4.54% -1.75%
- Pop!_OS 22.04 LTS 64 bit 4.46% -0.44%
- Flatpak runtime 64 bit 4.34% +4.34%
- Other 37.89% +6.29%
It's probably no surprise then that the most popular GPU currently being used on Linux is the Steam Deck too. The Steam Deck GPU accounts for 13.72% of Linux gamers on Steam, with the next most popular being the AMD Radeon RX 480 at 4.81%.
Clearly, the Steam Deck and SteamOS are taking over Linux Gaming and rather quickly too. Interestingly, if you filter to Windows, the Steam Deck GPU doesn't even show up so it's likely overall only a tiny amount of people are actually using Windows on it.
Quoting: LamdarerBut what bugs me the most is that while SteamOS Holo has 13.69% for Linux, the AMD Custom GPU has more 13.72%. Wouldnt that mean that there is a significant portion of Deck users who installed another Linux Distro on itand even more so if you consider that the Community Holo iso which can be installed anywhere also counts toward SteamDeckOS™.
Desktop use aside, 13.69 : 13.72 = 0.9978 => 0.22 % of Steam Desk users would be installing another Linux distribution. One in 450.

Quoting: mr-victoryExactly, even though one could argue that e.g. Endevour is closer to Arch than Ubuntu LTS to non LTS etc (not to mention Mint), and with ~40% other I would be very carefully with statements about which Linux Distro is "the most widely used"(even more so when you consider the other factors I mentioned), still it is a good indicator in general and I would love to see developers adding "Most modern Distros", "most Ubuntu 22.x. and Arch based Distros" or "ubuntu or SteamOS or Simular" to the System requirements section instead of just Ubuntu.Quoting: LamdarerCould be that Arch actually dominates with other derivatives like Endevour etc on the other side there is also Linux Mint or POP!_OS which are Ubuntu Based as well.Arch derivates have their own /etc/os-release (or whatever) and don't appear as Arch.

Quoting: LamdarerBut what bugs me the most is that while SteamOS Holo has 13.69% for Linux, the AMD Custom GPU has more 13.72%. Wouldnt that mean that there is a significant portion of Deck users who installed another Linux Distro on it
Another interesting thing...
Resolution 1280 x 800  12.45%

AMD Custom GPU 0405    13.72%
So ~9% of Deck Users had a monitor attached?
 Philadelphus Sep 5, 2022
Quoting: CatKillerMy post was mostly a tongue-in-cheek way of conveying hype.Quoting: PhiladelphusI think we need to start fitting an exponential rather than a straight line.As someone that nagged Liam into putting the trend line on the graph, the simple least-squares line that goes through the mean is the appropriate one to use. It's just a visualisation of the data; it isn't going to show any particular function. Whether the data points squiggle around the trend line, say, or has early data below the trend line and later data above the trend line, helps to visualise what the data are showing.
Actually, could you have multiple fits on the plot?

 Though just for fun I did my own least-square fit of a linear and an exponential function to the data, and – for this date range – the sum of the squares of the residuals was ever-so-slightly lower for the exponential, indicating that the data, on average, more closely resemble an exponential function than they do a linear one (though not by much).
Quoting: PhiladelphusI'm a nerd. I'm not a nerd for this particular kind of stuff, but I find I appreciate it when I see nerds nerding out about stuff even when it's not my particular stuff, you know? One of life's simple pleasures.Quoting: CatKillerMy post was mostly a tongue-in-cheek way of conveying hype.Quoting: PhiladelphusI think we need to start fitting an exponential rather than a straight line.As someone that nagged Liam into putting the trend line on the graph, the simple least-squares line that goes through the mean is the appropriate one to use. It's just a visualisation of the data; it isn't going to show any particular function. Whether the data points squiggle around the trend line, say, or has early data below the trend line and later data above the trend line, helps to visualise what the data are showing.
Actually, could you have multiple fits on the plot?
See more from me