With the Steam Hardware & Software Survey for April 2026 now live, we've seen a decrease compared with the all-time high from last month but still a good trend.
The overall operating system stats are now:
- Windows: 93.47%
- Linux: 4.52%
- macOS: 2.01%
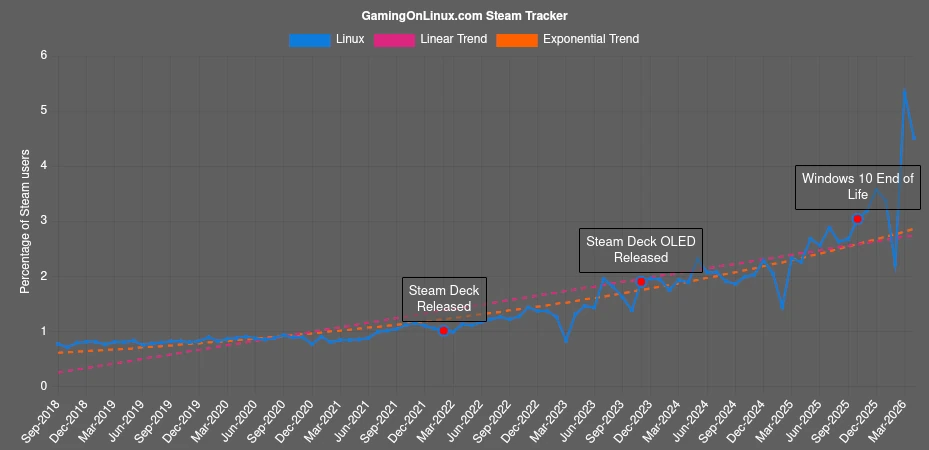
We've done a little upgrade to our dedicated Steam Tracker page for the trends over time today. The old original trend line has been removed, and replaced with two trend lines: Linear and Exponential (so we satisfy everyone). They're also added as actual labelled data sets, so on the main page they can be individually toggled. Here's a snapshot:
According to the data these were the most popular Linux distributions for April 2026:
- SteamOS Holo 64 bit 23.05% -1.43%
- Arch Linux 64 bit 8.78% 0.00%
- CachyOS 64 bit 8.37% +8.37%
- Linux Mint 22.3 64 bit 7.47% +0.57%
- 0 64 bit 5.94% -11.66%
- Bazzite 64 bit 4.74% +4.74%
- Freedesktop SDK 25.08 (Flatpak runtime) 64 bit 4.16% +4.16%
- Ubuntu Core 24 64 bit 3.58% 0.00%
- Ubuntu 24.04.4 LTS 64 bit 2.36% +2.36%
- 64 bit 1.90% -6.11%
- Fedora Linux 43 (KDE Plasma Desktop Edition) 64 bit 1.72% +1.72%
- Ubuntu 25.10 64 bit 1.53% -0.14%
- Linux Mint 22.2 64 bit 1.51% -0.39%
- Fedora Linux 43 (Workstation Edition) 64 bit 1.43% +1.43%
- Debian GNU/Linux 13 (trixie) 64 bit 1.40% +1.40%
- Manjaro Linux 64 bit 1.42% -0.03%
- Other 20.65% -4.99%
There's still a bit of weirdness going on, as two distributions show up that aren't actually named.
Source: Valve
About the author - Liam Dawe
I am the owner of GamingOnLinux. After discovering Linux back in the days of Mandrake in 2003, I constantly checked on the progress of Linux until Ubuntu appeared on the scene and it helped me to really love it. You can reach me easily by emailing GamingOnLinux directly. You can follow me personally on Mastodon [External Link].
See more from me
See more from me
Some you may have missed, popular articles from the last month:


All posts need to follow our rules. Please hit the Report Flag icon on any post that breaks the rules or contains illegal / harmful content. Readers can also email us for any issues or concerns.
32 comments

Quoting: jjaksicSteam Survey is useless garbage. It's not humanly possible to do polling and statistics any worse than this. Please ignore it, it's just worthless random noise junk not worth anyone's 2 seconds of attention (except maybe to teach a toddler how not to do statistics).You always this cheery or is it your birthday which caused you to just glow with joy and spread some love?
Last edited by TheSHEEEP on 3 May 2026 at 8:34 am UTC
3 Likes

Quoting: PlayingOnLinuxphoneSince people don't trust me, I also draw some lines:It's following a sigmoidal pattern not a heaviside linear ... Heaviside linear is means to approximate a sigmoidal
External Media: You need to be logged in to view this.
Everyone can extrapolate the line themselves.
It can only ever follow a sigmoidal and the is determining the steady state value (it won't be 100%... ) and the peak acceleration/adoption point.
I pasted a few sigmoidal fits for the last few updates and I expected a slight correction this month and it doesn't do anything to the general fit. 2030 for 10% is still on track.
0 Likes

Quoting: Naib2030 for 10% is still on track.Great. When do we reach 105% then?
0 Likes
Great, the exponential trend line follows the data a lot better. It's more representative than the linear one.
0 Likes
I don't get the fuss about trend lines. The problem I have with that is that slapping a trend line on the data is assuming that there is one function driving the shape of the actual curve that stays more or less the same throughout. While I am not a statistics person at all, to me this screams "oversimplification". If you assume instead that there are several factors at play on how the Linux share develops, factors that may interact with one another, that become relevant and possibly irrelevant again at arbitrary points of time, I don't see how a simple trend line is supposed to appropriately model all of that.
I mean, do you plot a person's height from age 0 to 13 and then predict how tall they are when they reach age 90? So what are those of you expecting from a trend line to do for you? Predict how unknown future events impact the development? Because in all likelihood, there will be such events. Of course you can say, "If the Linux share develops like it has, X will happen in Y years", but what purpose does that serve?
I don't mean to rage bait anyone or discredit anyone's opinion on that matter, I'm honestly curious what you expect of a trend line to do for you. All I can see it doing for me is separating noise from the signal, but that isn't as easy as finding a curve that fits nicely, either. At least I don't expect it to be.
1 Likes
 Liam Dawe 5 hours ago

I don’t get the fuss against it. People like different ways of looking at data 🤷♂️
1 Likes
The entire point is to cut through the sampling noise. Linear works to a point then the divergence becomes apparent.
Some form of exponent is then key to track it. At some point this will fail and a logistic is needed.
Some form of exponent is then key to track it. At some point this will fail and a logistic is needed.
0 Likes

Quoting: Liam DaweI don’t get the fuss against it.You can literally always find a polynomial that goes exactly through every point. You can literally always find a sine function that goes through every point.
Should you be plotting your points against some function your model needs explanatory power for why "percentage of Steam users running Linux" should be some factor of e raised to the power of "number of days since 2017," say, or "the tangent of days since 2017," or "the inverse of 1 plus e to the power of the negative of the number of days since 2017." Or whatever bullshit function looks a bit like it.
"Tee-hee I like de dot-to-dots" is meaningless gibberish.
That's why.
0 Likes
Liam Dawe 2 hours ago
Okay, well if you don't like them, toggle them off when you visit the page as you can do that now 👍
0 Likes
Quoting: Liam DaweOkay, well if you don't like them, toggle them off when you visit the page as you can do that now 👍Like I said, I understand why you put it there. No worries. And, yeah, being able to turn it off was a great move.
0 Likes
 PlayingOnLinuxphone 1 hour ago
Quoting: NaibIt's following a sigmoidal patternAs data shows, clearly not. I mean you can give me the formula for a smooth sigmoidal that fits into a 5.6 times increase from one month to another. That 5.6 times is steady for already 7 months. Your mistake is to not take the events into account and so you would over-simply what actually is happening.
Common growth is like accelerating a vehicle. It starts slow, will accelerate faster in the mid and slows down acceleration at the end again. But what happens with an event? A crash instantly slows down or increases the speed depending on the impact point and direction. And that was happening with Steam Deck and Win10 EOL as the data shows.
That being said, I also don't belief it will always stay a flat line. It can change at any point in the future. In my opinion it is just the best way to interpret (denoise) the current graph.
0 Likes

People coming to this site aren't data scientists looking to denoise a graph, they just want to know if Linux gaming is becoming more popular. You're overthinking it. Statistics are meant to represent information to a target audience in a way that's useful to them, not to be an arbiter of the "correct" way of measuring things.
Last edited by GoEsr on 3 May 2026 at 8:58 pm UTC
Last edited by GoEsr on 3 May 2026 at 8:58 pm UTC
0 Likes
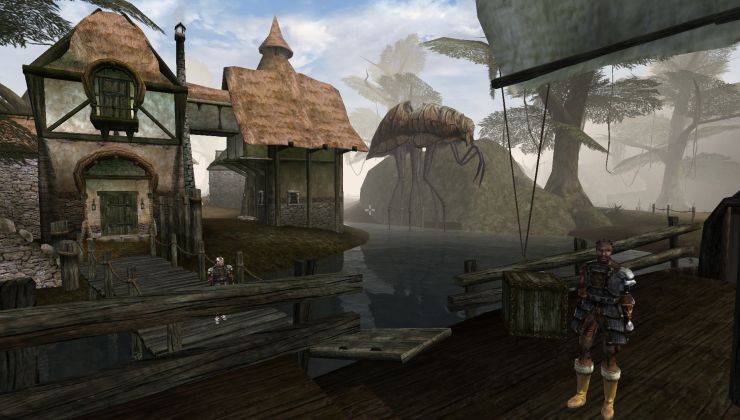 How to setup OpenMW for modern Morrowind on Linux / SteamOS and Steam Deck
 How to install Hollow Knight: Silksong mods on Linux, SteamOS and Steam Deck